
In the previous article, we covered the inconsistency of test markers reported despite our clients requesting exactly the same blood test markers.
But even when every single marker is reported, there’s an even more fundamental problem with blood test results and it’s the way they’re interpreted.
Specifically, it’s the concept of a ‘normal’ range that’s important to explain.
As you may have experienced, it’s all too common for folk to go to the doc and get a blood test, only to be told everything is ‘normal’.
“Hang on a minute”, you think… “I feel like crap – I’m tired, moody and achy; my digestion isn’t working right and my skin is dry and dull… I’m not sleeping and my sex drive has dropped through the floor. HOW THE HELL CAN I BE NORMAL?!”
The explanation is quite simple.
The lab reference ranges are really, really wide
If you look closely as a blood test result, you’ll see that the ‘normal’ ranges are actually quite wide.
For example, the ‘normal range’ for Gamma GT (GGT – a liver enzyme) is 10-71 iu/L.
In other words, you can have ten times more GGT than someone else and still be considered the ‘same’ as them for that marker.
Is it really reasonable to think that someone with seven times more GGT is going to be in the same state of health as someone else?
Hmmm. I don’t think so.
It’s a bit weird, I know, so stay with me.
How are reference ranges derived?
Lab reference ranges come from population statistics, which themselves always follow what’s known as a Gaussian curve, as you can see below.
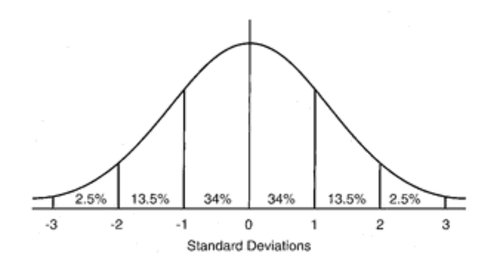
With any biological measure – height or weight, for example – people will fall into this chart somewhere.
The further from centre (zero) you go (i.e. 1 or 2 standard deviations), the less ‘average’ you become.
Really tall people or really short people are in the higher or lower 2.5%, between the second and third standard deviations.
If you add 34% + 34% + 13.5% + 13.5% + 2.5% + 2.5%, you get 100%, or all the people.
Now, when it comes to blood chemistry markers and any other lab test marker, for that matter, you’re considered normal unless you’re in the 2.5% of the people at either end of the distribution.
(Phew, that’s tough for a non-mathematician to explain!)
Ponder this…
Imagine your perfect level for a certain hormone is 4.8.
That’s the level your body works best at.
The normal range for that marker is 2.0 – 5.5.
In a blood test, your level is shown to be 2.4, which is HALF your personal ideal level.
But it is comfortably inside the ‘normal’ reference range, so your doctor sends you home saying you’re normal and there’s nothing to worry about.
Do you think a 50% reduction in your hormone level might impact the way you feel, even though you’re in the ‘normal’ range?
YOU BET IT MIGHT!
Now imagine this happening with 20, 30, 40 or more different markers and you can see where the problems lie.
The ‘normal’ reference range is based on SICK people!
To make matters worse, let’s ask another prudent question:
“Who goes to the doctor to have blood tests – is it healthy people who feel great, or unhealthy people who feel like something is wrong?”
Obviously some health-conscious people want to have a check-up from time-to-time, but I’m sure you’ll agree that the majority of people only ask for lab tests when they’re not feeling very well.
So what does this mean?
First, it means that medical reference ranges – the ones you see on blood tests from your doctor – are based on sick people.
Second, it means that when your blood test results fall into the standard normal ranges, you’re ‘normal’ for a sick population.
No wonder you’re told you’re normal – you’re a person who doesn’t feel well being compared to other people who don’t feel well!
As people have become sicker and sicker through time, you might be surprised to learn that many reference ranges have widened.
The upper and lower limits get pushed out further and further as we abuse our bodies with stressful lifestyles, a toxic environment, and poor food choices.
How do you get round this?
OK, so the lab reference ranges are extremely wide AND they’re based on a sick population.
There’s very little, if any, data for truly healthy populations because people who feel great rarely ask for tests!
The only sensible way to get round this is to narrow the reference ranges that represent much tighter balance in blood markers.
In other words, you pull the upper limit down, and the lower limit up.
The range becomes tighter and you assess your levels according to those tighter ranges.
We call this new, tighter range, a functional range as opposed to a pathological range.
I’ll explain the difference between the two, along with some helpful graphics, in the third article.
Then, I’ll show you how you can avoid being deceived by your blood test results and finally make sense of them if you’re not feeling well.
Click here to read the third article.
Click here to see the previous article.
Best,
Dave.
Comments are closed.